UNITED STATES
SECURITIES AND EXCHANGE COMMISSION
Washington, D.C. 20549
FORM
CURRENT REPORT
Pursuant to Section 13 OR 15(d)
of the Securities Exchange Act of 1934
Date of Report (Date of earliest event reported):
(Exact name of registrant as specified in its charter)
| (State or other jurisdiction of incorporation) |
(Commission File Number) |
(IRS Employer Identification No.) |
(Address of principal executive offices, including zip code)
Registrant’s telephone number, including area code
(
(Former name or former address, if changed since last report)
Check the appropriate box below if the Form 8-K filing is intended to simultaneously satisfy the filing obligation of the registrant under any of the following provisions:
Written communications pursuant to Rule 425 under the Securities Act (17 CFR 230.425) |
Soliciting material pursuant to Rule 14a-12 under the Exchange Act (17 CFR 240.14a-12) |
Pre-commencement communications pursuant to Rule 14d-2(b) under the Exchange Act (17 CFR 240.14d-2(b)) |
Pre-commencement communications pursuant to Rule 13e-4(c) under the Exchange Act (17 CFR 240.13e-4(c)) |
Securities registered pursuant to Section 12(b) of the Act:
Title of each class |
Trading |
Name of each exchange | ||
Indicate by check mark whether the registrant is an emerging growth company as defined in Rule 405 of the Securities Act of 1933 (§230.405 of this chapter) or Rule 12b-2 of the Securities Exchange Act of 1934 (§240.12b-2 of this chapter).
Emerging growth company
If an emerging growth company, indicate by check mark if the registrant has elected not to use the extended transition period for complying with any new or revised financial accounting standards provided pursuant to Section 13(a) of the Exchange Act.
| Item 7.01 | Regulation FD Disclosure. |
On June 23, 2026, Teamshares Inc. (the “Company”) issued a press release announcing that its common stock has begun trading on The Nasdaq Stock Market LLC under the new trading symbol “TMS”. The press release is furnished as Exhibit 99.1 to this Current Report on Form 8-K and is incorporated herein by reference.
On June 24, 2026, the Company posted an investor presentation on its website. The presentation may be found on the Company’s website at www.teamshares.com by selecting “For Investors,” “News & Events” and then “Presentations.” The investor presentation is furnished as Exhibit 99.2 to this Current Report on Form 8-K and is incorporated herein by reference. Information on the Company’s website does not constitute a part of this Current Report on Form 8-K.
Information in this Item 7.01 and Exhibits 99.1 and 99.2 of Item 9.01 below shall not be deemed “filed” for the purposes of Section 18 of the Securities Exchange Act of 1934, as amended (the “Exchange Act”), or otherwise incorporated by reference into any filing pursuant to the Securities Act of 1933, as amended, or the Exchange Act except as otherwise expressly stated in such a filing.
| Item 9.01 | Financial Statements and Exhibits. |
(d) Exhibits
Exhibit |
Description | |
| 99.1 | Press Release by Teamshares Inc. on June 23, 2026 | |
| 99.2 | Investor Presentation by Teamshares Inc. on June 24, 2026 | |
| 104 | Cover Page Interactive Data File (embedded within the Inline XBRL document) | |
2
SIGNATURES
Pursuant to the requirements of the Securities Exchange Act of 1934, as amended, the registrant has duly caused this report to be signed on its behalf by the undersigned hereunto duly authorized.
Date: June 24, 2026
| TEAMSHARES INC. | ||
| By: | /s/ Brian Gaebe | |
| Name: | Brian Gaebe | |
| Title: | Chief Financial Officer | |
3
Exhibit 99.1

Source: Teamshares, Inc.
June 23, 2026 09:15 ET
TMS Begins Trading on Nasdaq Today; Teamshares is the Market-Leading Acquiror of Businesses From Retiring Owners
| • | Tech-enabled holding company has grown to 93 businesses since 2020 |
| • | Seeks to be a permanent home for thousands of great companies as owners retire |
| • | TMS software sources 75,000 actively for sale businesses per year |
| • | T Rowe Price Investment Management anchors $126.5M equity investment in TMS |
NEW YORK, June 23, 2026 (GLOBE NEWSWIRE) -- Teamshares (Nasdaq: TMS), a tech-enabled acquiror of SMEs, began trading publicly today. Teamshares is the market-leading acquiror of businesses from retiring owners. Teamshares is part holdco, part fintech, and aligns employees through stock ownership.
Teamshares cofounder and CEO Michael Brown said, “We’re proud to be the market leader in buying businesses from retiring owners. Going public provides us with additional financing options to expand our model to thousands of great companies over time.”
Alex Eu, Teamshares cofounder and President, added, “The Teamshares platform is built and it is working to repeatedly transition and grow successful businesses. We believe our unique combination of qualified leaders, financial infrastructure, and shareholder alignment through employee stock ownership is why Teamshares companies have strong, reliable organic growth.”
“Every company we acquire strengthens our proprietary dataset that makes the next acquisition smarter. Our software and AI work across underwriting, operations, and financial oversight, compounding with every transaction. Going public lets us accelerate that flywheel at exactly the moment millions of small business owners are retiring,” said Kevin Shiiba, cofounder and CTO.
About Teamshares
Teamshares is a tech-enabled acquiror of SMEs, intending to be a permanent home when owners retire. Part holdco, part fintech, Teamshares programmatically acquires companies with $0.5 to $5 million of EBITDA from retiring owners, integrates them with the Teamshares platform, and helps employees earn company stock. Founded in 2019, Teamshares operates subsidiaries with consolidated revenue of $490 million across over 40 industries and 30 states. Learn more at https://www.teamshares.com/investors.
Forward Looking Statements
This press release contains forward-looking statements within the meaning of the U.S. federal securities laws. Forward-looking statements include statements concerning plans, objectives, goals, strategies, future events or performance, and underlying assumptions and other statements that are other than statements of historical facts. No representations or warranties, express or implied are given in, or in respect of, this press release. These forward-looking statements generally are identified by the words “believe,” “project,” “expect,” “anticipate,” “estimate,” “intend,” “strategy,” “future,” “opportunity,” “potential,” “plan,” “may,” “should,” “will,” “would,” “will be,” “will continue,” “will likely result,” and similar expressions. These forward-looking statements also include, but are not limited to, statements regarding estimation of the listing. These statements are based on various assumptions, whether or not identified in this press release, and on the current expectations of Teamshares management and are not predictions of actual performance. These statements involve risks, uncertainties and other factors that may cause the actual results, levels of activity, performance, or achievements to be materially different from those expressed or implied by these forward-looking statements. Although Teamshares believes that it has a reasonable basis for each forward-looking statement contained in this press release, Teamshares cautions you that these statements are based on a combination of facts and factors currently known and projections of the future, which are inherently uncertain. The forward-looking statements in this press release represent the views of Teamshares as of the date of this press release. Subsequent events and developments may cause those views to change. Except as may be required by law, Teamshares does not undertake any duty to update these forward-looking statements.
Contacts
Investor Relations: Investors@teamshares.com Press:
Press@teamshares.com

1 Exhibit 99.2 Investor Introduction NASDAQ: TMS A permanent home for great businesses when owners retire

2 Teamshares is a Part holdco. Part fintech. tech-enabled We programmatically acquire companies with $0.5 to 5 million of acquiror of SMEs, EBITDA from retiring owners, and a permanent integrate them with the Teamshares platform, and help home for great employees earn company stock businesses
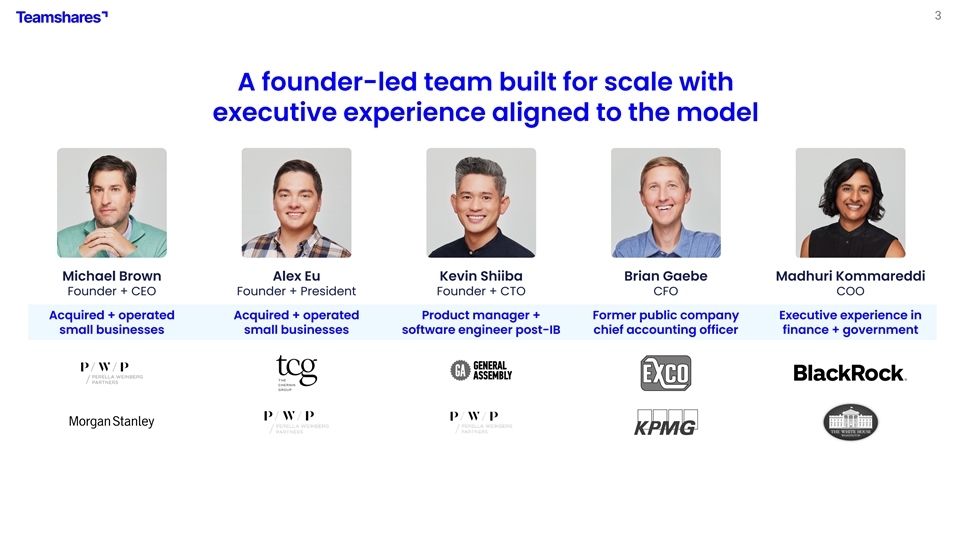
3 A founder-led team built for scale with executive experience aligned to the model Michael Brown Alex Eu Kevin Shiiba Brian Gaebe Madhuri Kommareddi Founder + CEO Founder + President Founder + CTO CFO COO Acquired + operated Acquired + operated Product manager + Former public company Executive experience in small businesses small businesses software engineer post-IB chief accounting officer finance + government
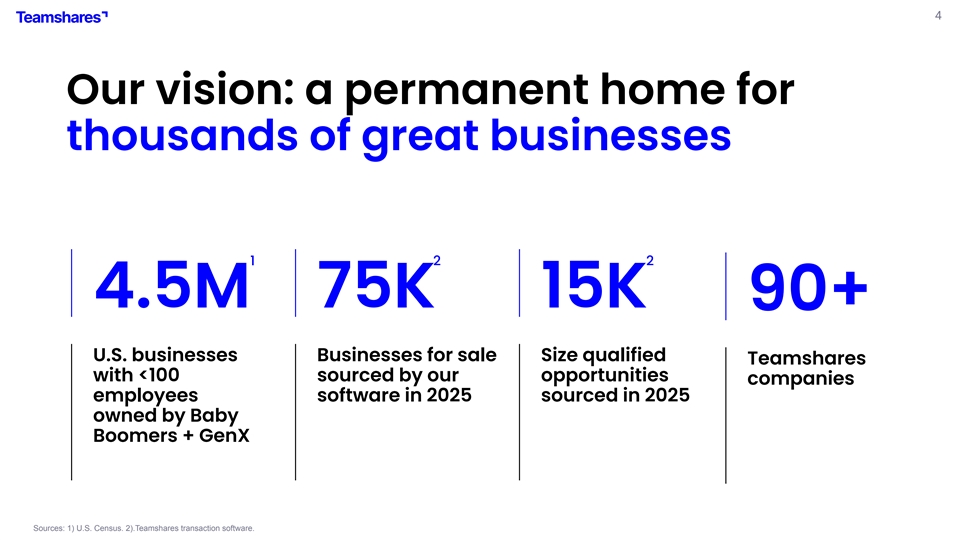
4 Our vision: a permanent home for thousands of great businesses 1 2 2 4.5M 75K 15K 90+ U.S. businesses Businesses for sale Size qualified Teamshares with <100 sourced by our opportunities companies employees software in 2025 sourced in 2025 owned by Baby Boomers + GenX Sources: 1) U.S. Census. 2).Teamshares transaction software.
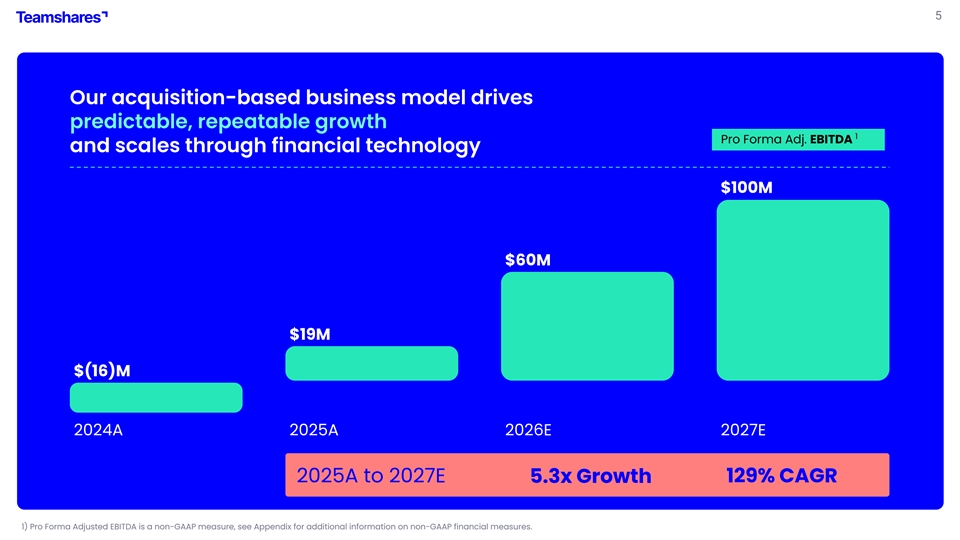
5 Our acquisition-based business model drives predictable, repeatable growth 1 Pro Forma Adj. EBITDA and scales through financial technology $100M $60M $19M $(16)M 2024A 2025A 2026E 2027E 2025A to 2027E 5.3x Growth 129% CAGR 1) Pro Forma Adjusted EBITDA is a non-GAAP measure, see Appendix for additional information on non-GAAP financial measures.
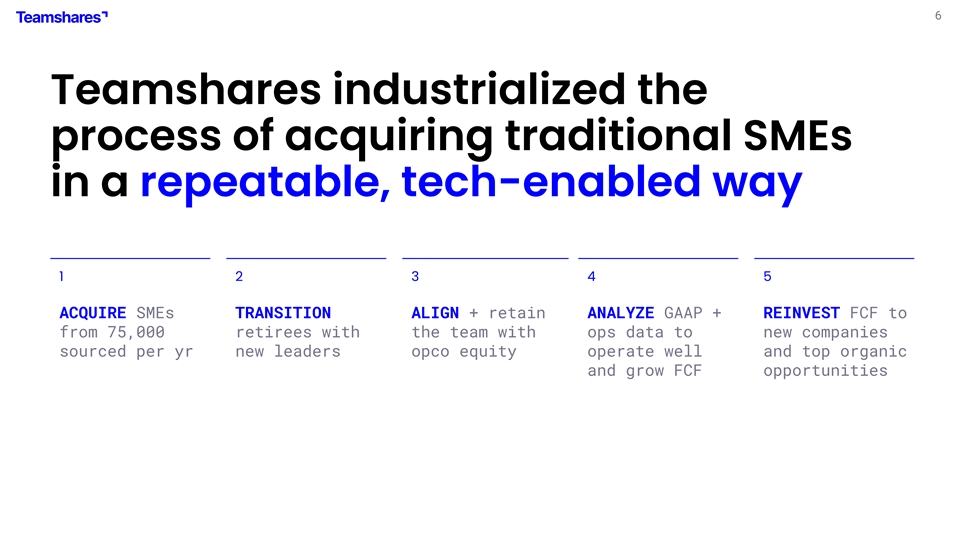
6 Teamshares industrialized the process of acquiring traditional SMEs in a repeatable, tech-enabled way 1 2 3 4 5 ACQUIRE SMEs TRANSITION ALIGN + retain ANALYZE GAAP + REINVEST FCF to from 75,000 retirees with the team with ops data to new companies sourced per yr new leaders opco equity operate well and top organic and grow FCF opportunities

7 A growth strategy to outpace organic growth Programmatic acquiror business model 90+ companies six years in
8 A significant and actionable market Millions of SMEs need to sell next decade-plus 4.5M SMEs owned by Boomers/GenX in US alone Source: US Census.
9 We’re unique and we win Strong differentiation with retiring owners 50% lifetime win rate on LOIs

10 Centralized fintech and decentralized leadership Our repeatable, scalable platform enables growth 15,000 size-qualified listings annually 50+ applications per president opening

11 Acquisition financing is our raw material Better capital access as a public company Public credit is cheaper, deeper, faster Public equity is an advantage for Teamshares

12 Disciplined capital allocation Compounding cash flow at attractive rates 27-37% of purchase price recovered in upstreamed cash at T+24 months Note: See explanation of this measure on Slide 50.
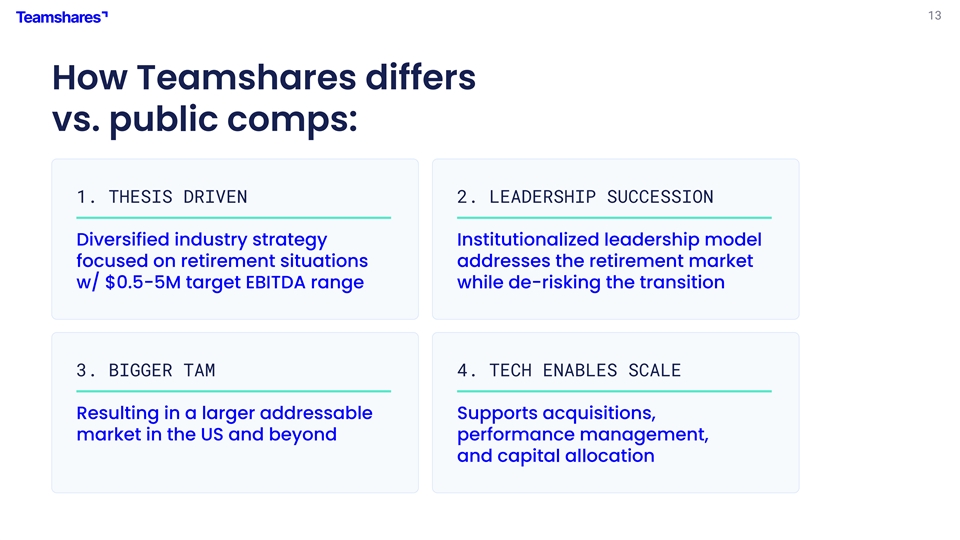
13 How Teamshares differs vs. public comps: 1. THESIS DRIVEN 2. LEADERSHIP SUCCESSION Diversified industry strategy Institutionalized leadership model focused on retirement situations addresses the retirement market w/ $0.5-5M target EBITDA range while de-risking the transition 3. BIGGER TAM 4. TECH ENABLES SCALE Resulting in a larger addressable Supports acquisitions, market in the US and beyond performance management, and capital allocation
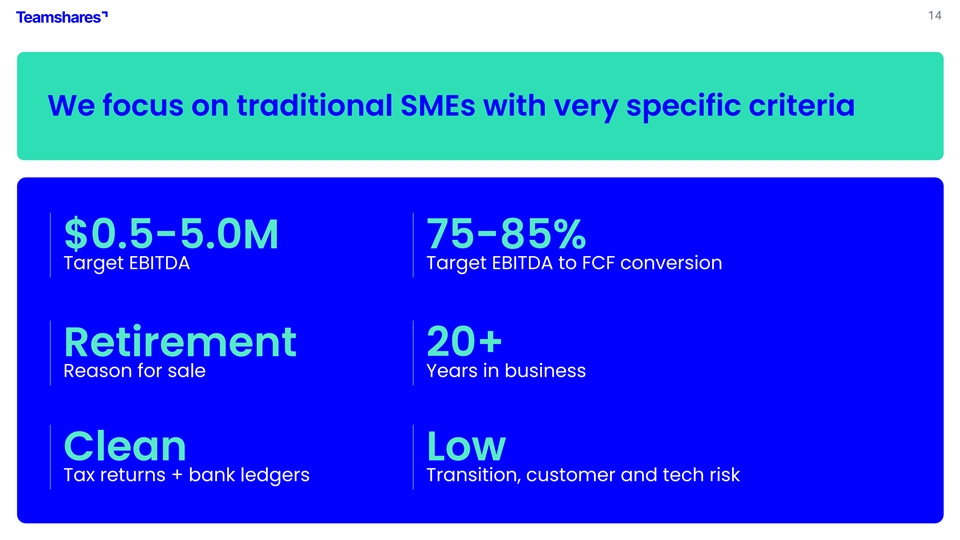
14 We focus on traditional SMEs with very specific criteria $0.5-5.0M 75-85% Target EBITDA Target EBITDA to FCF conversion Retirement 20+ Reason for sale Years in business Clean Low Tax returns + bank ledgers Transition, customer and tech risk
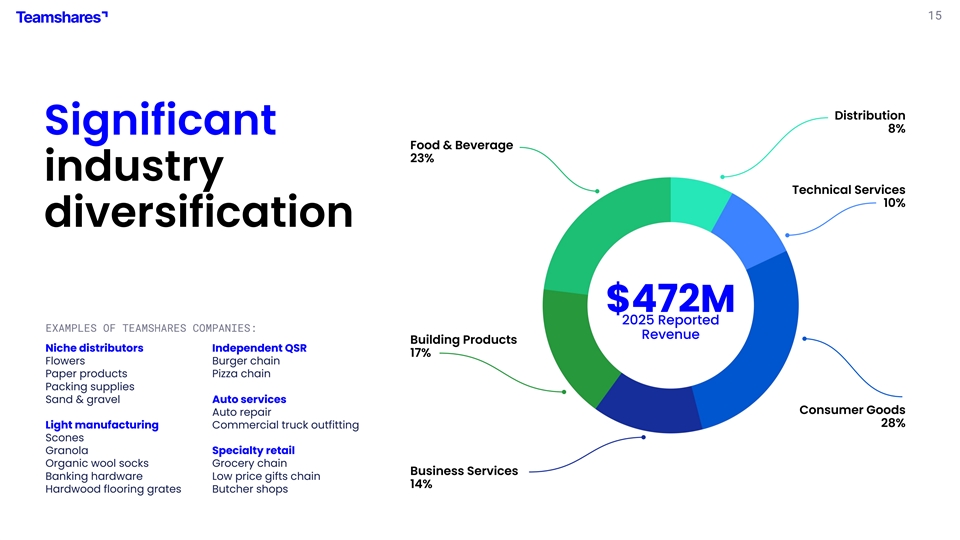
15 Distribution 8% Significant Food & Beverage 23% industry Technical Services 10% diversification $472M 2025 Reported EXAMPLES OF TEAMSHARES COMPANIES: Revenue Building Products Niche distributors Independent QSR 17% Flowers Burger chain Paper products Pizza chain Packing supplies Sand & gravel Auto services Consumer Goods Auto repair 28% Light manufacturing Commercial truck outfitting Scones Granola Specialty retail Organic wool socks Grocery chain Business Services Banking hardware Low price gifts chain 14% Hardwood flooring grates Butcher shops
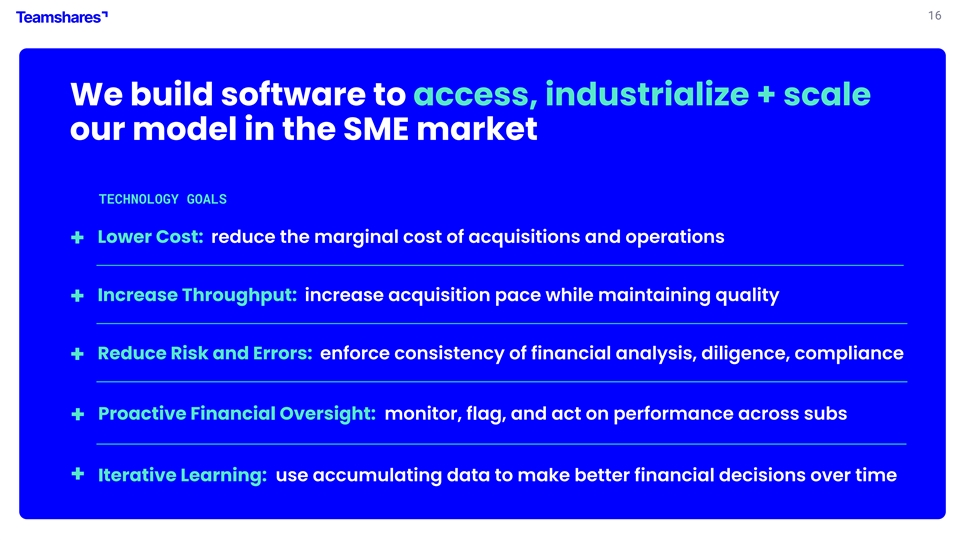
16 We build software to access, industrialize + scale our model in the SME market TECHNOLOGY GOALS Lower Cost: reduce the marginal cost of acquisitions and operations + Increase Throughput: increase acquisition pace while maintaining quality + Reduce Risk and Errors: enforce consistency of financial analysis, diligence, compliance + Proactive Financial Oversight: monitor, flag, and act on performance across subs + Iterative Learning: use accumulating data to make better financial decisions over time +
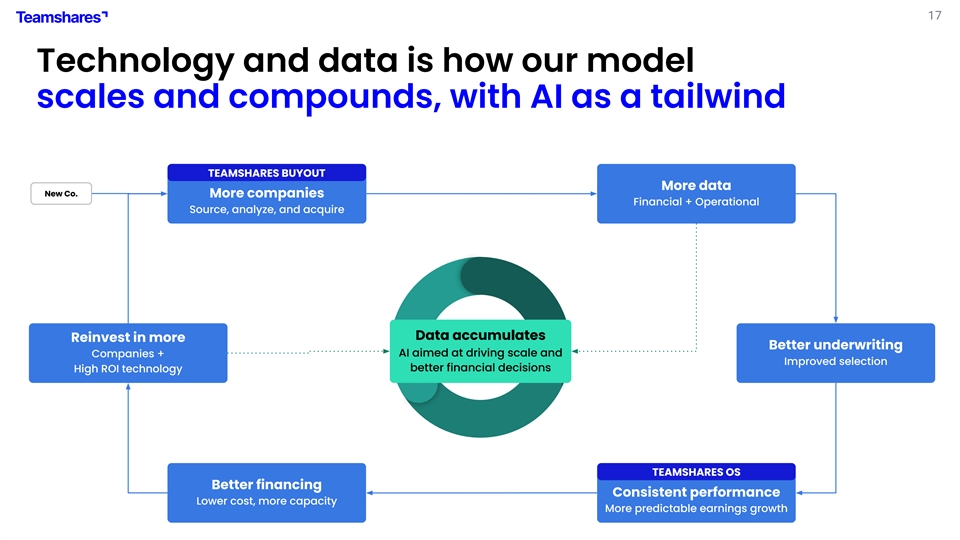
17 Technology and data is how our model scales and compounds, with AI as a tailwind TEAMSHARES BUYOUT More data New Co. More companies Financial + Operational Source, analyze, and acquire Data accumulates Reinvest in more Better underwriting Companies + AI aimed at driving scale and Improved selection High ROI technology better financial decisions TEAMSHARES OS Better financing Consistent performance Lower cost, more capacity More predictable earnings growth
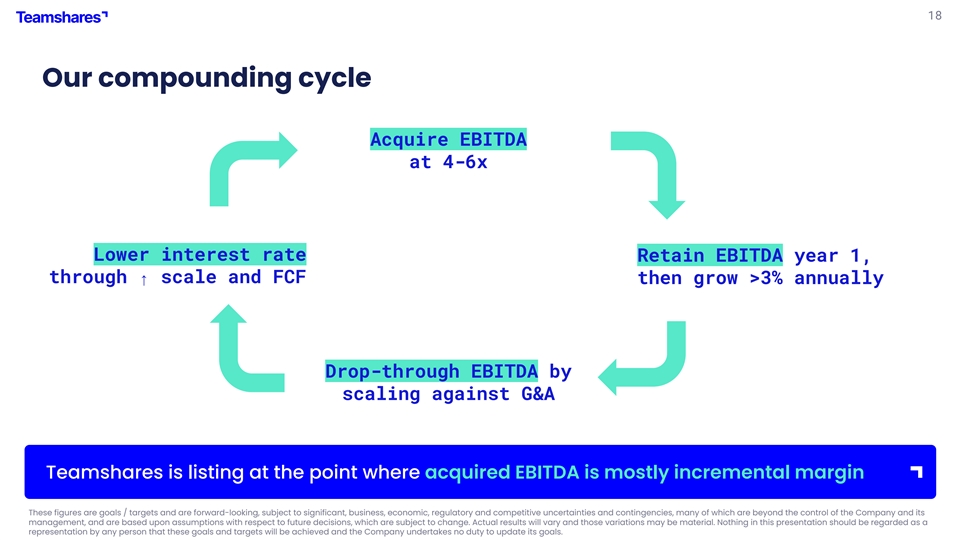
18 Our compounding cycle Acquire EBITDA at 4-6x Lower interest rate Retain EBITDA year 1, through ↑ scale and FCF then grow >3% annually Drop-through EBITDA by scaling against G&A Teamshares is listing at the point where acquired EBITDA is mostly incremental margin These figures are goals / targets and are forward-looking, subject to significant, business, economic, regulatory and competitive uncertainties and contingencies, many of which are beyond the control of the Company and its management, and are based upon assumptions with respect to future decisions, which are subject to change. Actual results will vary and those variations may be material. Nothing in this presentation should be regarded as a representation by any person that these goals and targets will be achieved and the Company undertakes no duty to update its goals.
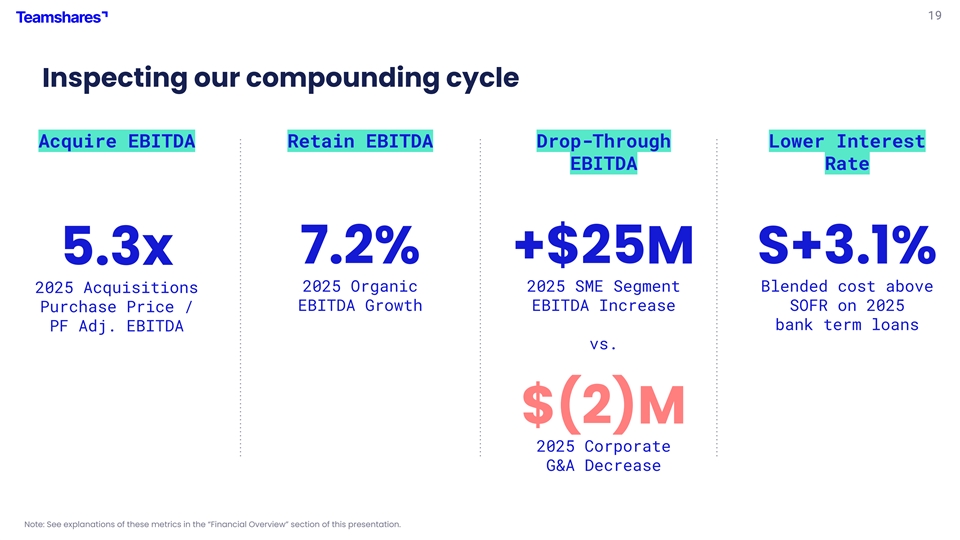
19 Inspecting our compounding cycle Acquire EBITDA Retain EBITDA Drop-Through Lower Interest EBITDA Rate 7.2% +$25M S+3.1% 5.3x 2025 Organic 2025 SME Segment Blended cost above 2025 Acquisitions EBITDA Growth EBITDA Increase SOFR on 2025 Purchase Price / bank term loans PF Adj. EBITDA vs. $(2)M 2025 Corporate G&A Decrease Note: See explanations of these metrics in the “Financial Overview” section of this presentation.
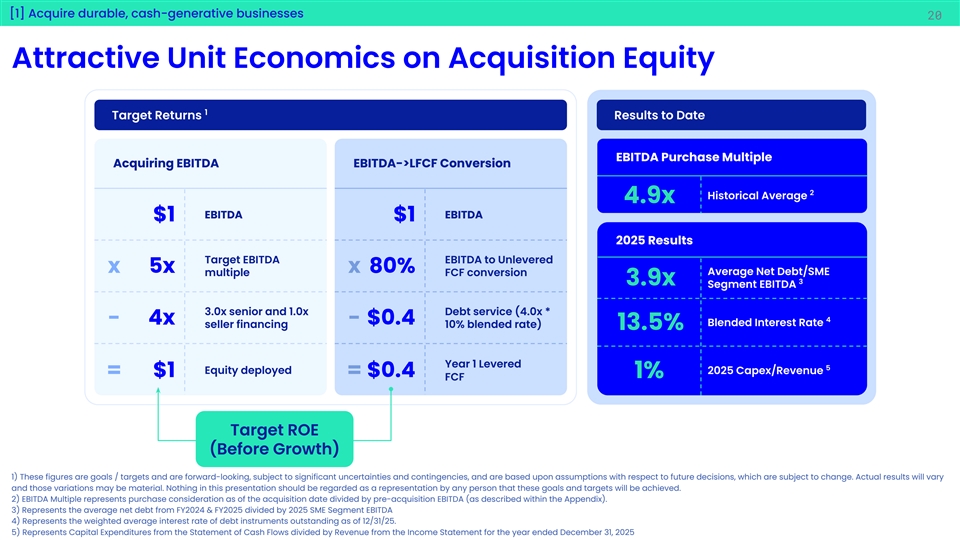
[1] Acquire durable, cash-generative businesses 20 20 Attractive Unit Economics on Acquisition Equity 1 Target Returns Results to Date EBITDA Purchase Multiple Acquiring EBITDA EBITDA->LFCF Conversion 2 Historical Average 4.9x EBITDA EBITDA $1 $1 2025 Results Target EBITDA EBITDA to Unlevered x 5x x 80% multiple FCF conversion Average Net Debt/SME 3 3.9x Segment EBITDA 3.0x senior and 1.0x Debt service (4.0x * 4 - 4x - $0.4 Blended Interest Rate seller financing 10% blended rate) 13.5% Year 1 Levered 5 Equity deployed 2025 Capex/Revenue = $1 = $0.4 1% FCF Target ROE (Before Growth) 1) These figures are goals / targets and are forward-looking, subject to significant uncertainties and contingencies, and are based upon assumptions with respect to future decisions, which are subject to change. Actual results will vary and those variations may be material. Nothing in this presentation should be regarded as a representation by any person that these goals and targets will be achieved. 2) EBITDA Multiple represents purchase consideration as of the acquisition date divided by pre-acquisition EBITDA (as described within the Appendix). 3) Represents the average net debt from FY2024 & FY2025 divided by 2025 SME Segment EBITDA 4) Represents the weighted average interest rate of debt instruments outstanding as of 12/31/25. 5) Represents Capital Expenditures from the Statement of Cash Flows divided by Revenue from the Income Statement for the year ended December 31, 2025
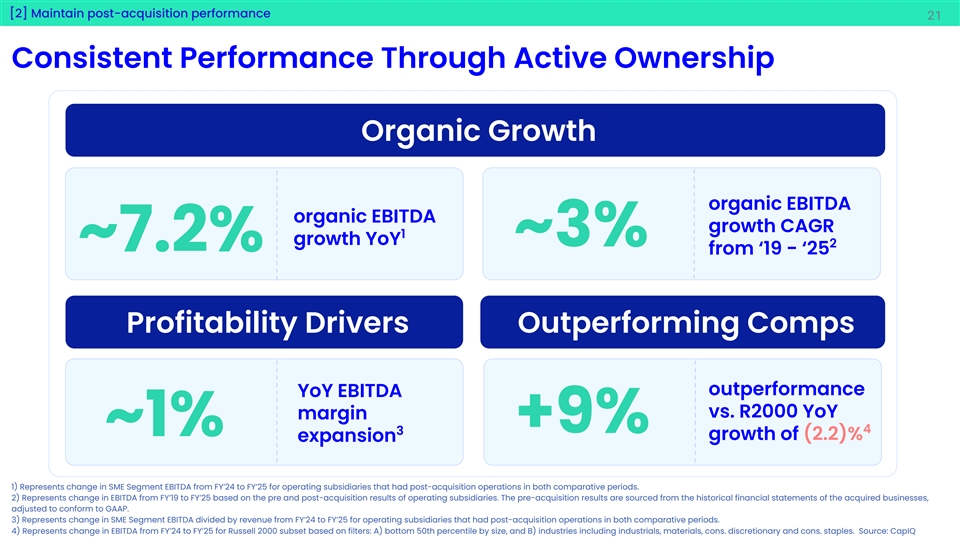
[2] Maintain post-acquisition performance 21 21 Consistent Performance Through Active Ownership Organic Growth organic EBITDA organic EBITDA growth CAGR 1 growth YoY ~3% 2 ~7.2% from ‘19 - ‘25 Profitability Drivers Outperforming Comps outperformance YoY EBITDA vs. R2000 YoY margin +9% 4 3 ~1% growth of (2.2)% expansion 1) Represents change in SME Segment EBITDA from FY’24 to FY’25 for operating subsidiaries that had post-acquisition operations in both comparative periods. 2) Represents change in EBITDA from FY’19 to FY’25 based on the pre and post-acquisition results of operating subsidiaries. The pre-acquisition results are sourced from the historical financial statements of the acquired businesses, adjusted to conform to GAAP. 3) Represents change in SME Segment EBITDA divided by revenue from FY’24 to FY’25 for operating subsidiaries that had post-acquisition operations in both comparative periods. 4) Represents change in EBITDA from FY’24 to FY’25 for Russell 2000 subset based on filters: A) bottom 50th percentile by size, and B) industries including industrials, materials, cons. discretionary and cons. staples. Source: CapIQ
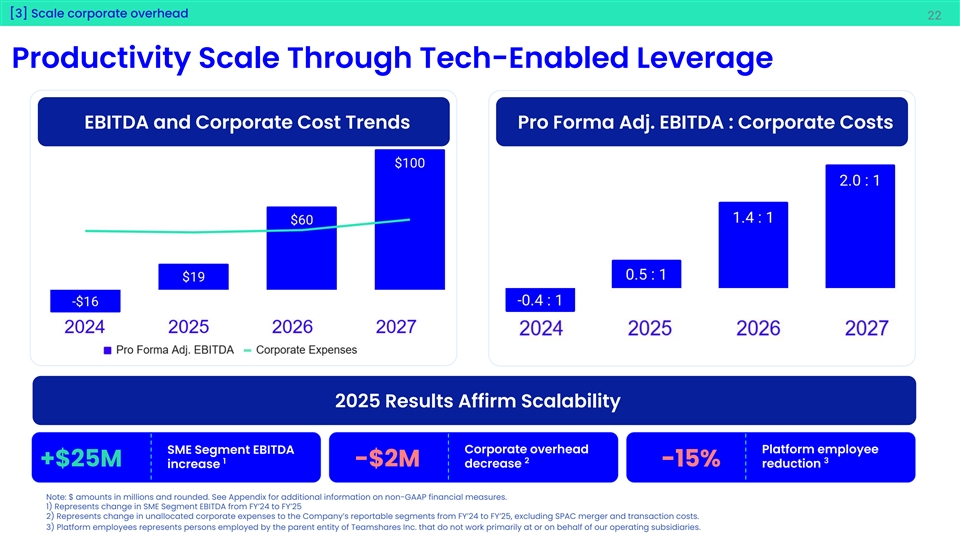
[3] Scale corporate overhead 22 22 Productivity Scale Through Tech-Enabled Leverage EBITDA and Corporate Cost Trends Pro Forma Adj. EBITDA : Corporate Costs 2025 Results Affirm Scalability Corporate overhead Platform employee SME Segment EBITDA 1 2 3 +$25M -$2M -15% increase decrease reduction Note: $ amounts in millions and rounded. See Appendix for additional information on non-GAAP financial measures. 1) Represents change in SME Segment EBITDA from FY’24 to FY’25 2) Represents change in unallocated corporate expenses to the Company’s reportable segments from FY’24 to FY’25, excluding SPAC merger and transaction costs. 3) Platform employees represents persons employed by the parent entity of Teamshares Inc. that do not work primarily at or on behalf of our operating subsidiaries.
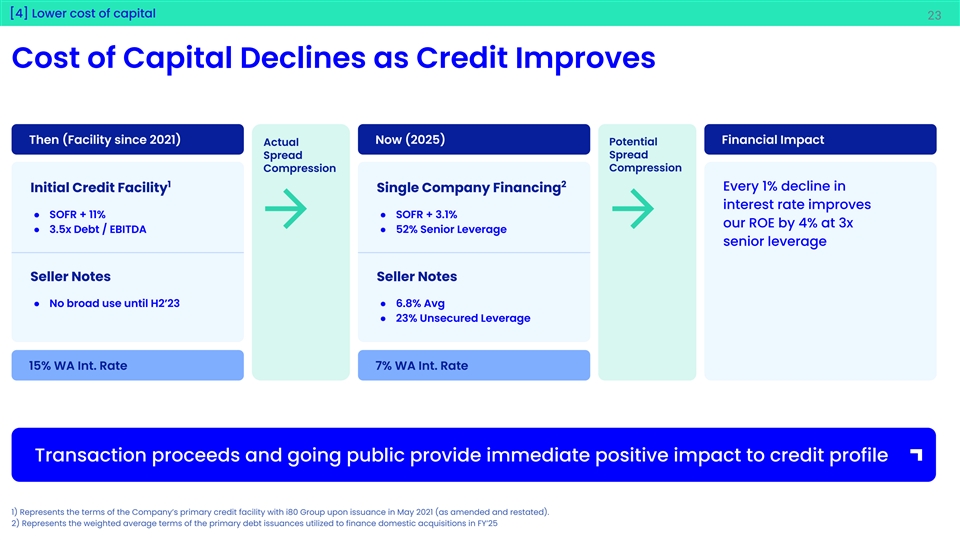
[4] Lower cost of capital 23 23 Cost of Capital Declines as Credit Improves Then (Facility since 2021) Now (2025) Financial Impact Potential Actual Spread Spread Compression Compression 1 2 Every 1% decline in Initial Credit Facility Single Company Financing interest rate improves ● SOFR + 11% ● SOFR + 3.1% our ROE by 4% at 3x ● 3.5x Debt / EBITDA ● 52% Senior Leverage senior leverage Seller Notes Seller Notes ● No broad use until H2’23 ● 6.8% Avg ● 23% Unsecured Leverage 15% WA Int. Rate 7% WA Int. Rate Transaction proceeds and going public provide immediate positive impact to credit profile 1) Represents the terms of the Company’s primary credit facility with i80 Group upon issuance in May 2021 (as amended and restated). 2) Represents the weighted average terms of the primary debt issuances utilized to finance domestic acquisitions in FY’25
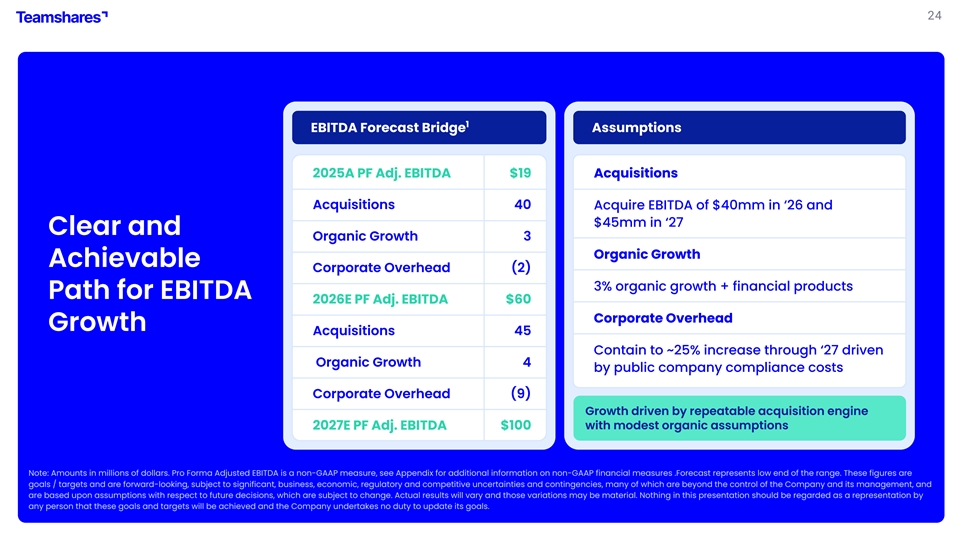
24 1 EBITDA Forecast Bridge Assumptions 2025A PF Adj. EBITDA $19 Acquisitions Acquisitions 40 Acquire EBITDA of $40mm in ‘26 and $45mm in ‘27 Clear and Organic Growth 3 Organic Growth Achievable Corporate Overhead (2) 3% organic growth + financial products Path for EBITDA 2026E PF Adj. EBITDA $60 Corporate Overhead Growth Acquisitions 45 Contain to ~25% increase through ‘27 driven Organic Growth 4 by public company compliance costs Corporate Overhead (9) Growth driven by repeatable acquisition engine with modest organic assumptions 2027E PF Adj. EBITDA $100 Note: Amounts in millions of dollars. Pro Forma Adjusted EBITDA is a non-GAAP measure, see Appendix for additional information on non-GAAP financial measures .Forecast represents low end of the range. These figures are goals / targets and are forward-looking, subject to significant, business, economic, regulatory and competitive uncertainties and contingencies, many of which are beyond the control of the Company and its management, and are based upon assumptions with respect to future decisions, which are subject to change. Actual results will vary and those variations may be material. Nothing in this presentation should be regarded as a representation by any person that these goals and targets will be achieved and the Company undertakes no duty to update its goals.
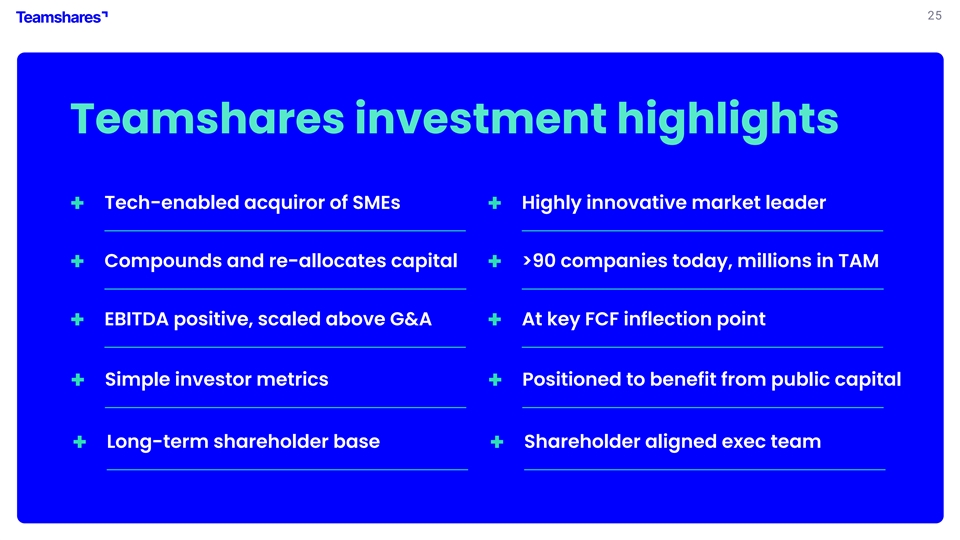
25 Teamshares investment highlights Tech-enabled acquiror of SMEs Highly innovative market leader + + Compounds and re-allocates capital >90 companies today, millions in TAM + + EBITDA positive, scaled above G&A At key FCF inflection point + + Simple investor metrics Positioned to benefit from public capital + + Long-term shareholder base Shareholder aligned exec team + +

26 It’s still Day One at
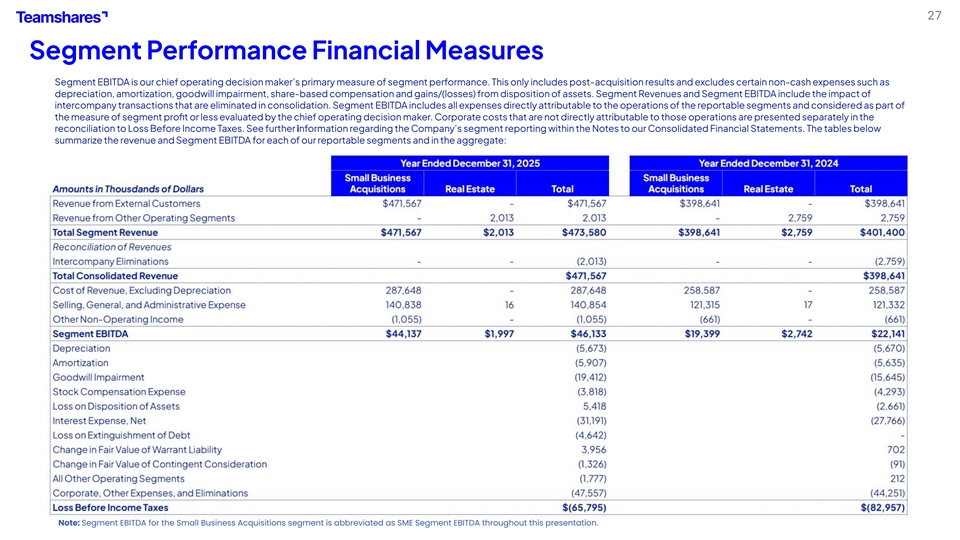
27 Segment Performance Financial Measures Segment EBITDA is our chief operating decision maker’s primary measure of segment performance. This only includes post-acquisition results and excludes certain non-cash expenses such as depreciation, amortization, goodwill impairment, share-based compensation and gains/(losses) from disposition of assets. Segment Revenues and Segment EBITDA include the impact of intercompany transactions that are eliminated in consolidation. Segment EBITDA includes all expenses directly attributable to the operations of the reportable segments and considered as part of the measure of segment profit or less evaluated by the chief operating decision maker. Corporate costs that are not directly attributable to those operations are presented separately in the reconciliation to Loss Before Income Taxes. See further information regarding the Company’s segment reporting within the Notes to our Consolidated Financial Statements. The tables below summarize the revenue and Segment EBITDA for each of our reportable segments and in the aggregate: Note: Segment EBITDA for the Small Business Acquisitions segment is abbreviated as SME Segment EBITDA throughout this presentation.
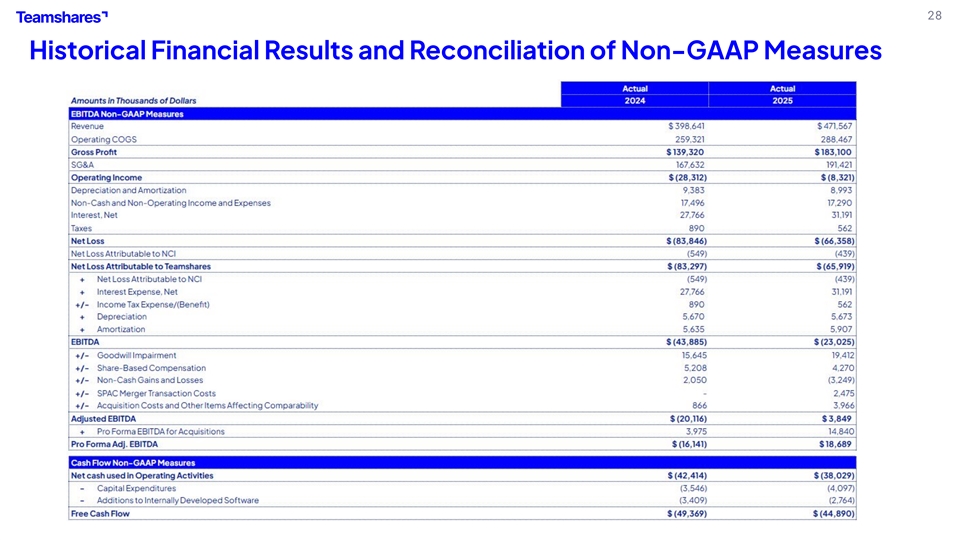
28 Historical Financial Results and Reconciliation of Non-GAAP Measures
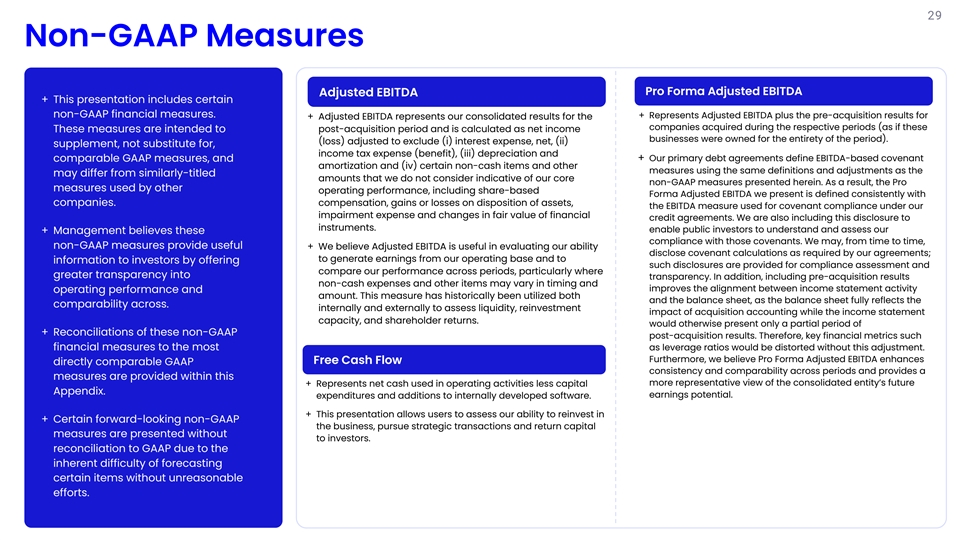
29 Non-GAAP Measures Adjusted EBITDA Pro Forma Adjusted EBITDA + This presentation includes certain non-GAAP financial measures. + Represents Adjusted EBITDA plus the pre-acquisition results for + Adjusted EBITDA represents our consolidated results for the companies acquired during the respective periods (as if these post-acquisition period and is calculated as net income These measures are intended to businesses were owned for the entirety of the period). (loss) adjusted to exclude (i) interest expense, net, (ii) supplement, not substitute for, income tax expense (benefit), (iii) depreciation and + Our primary debt agreements define EBITDA-based covenant comparable GAAP measures, and amortization and (iv) certain non-cash items and other measures using the same definitions and adjustments as the may differ from similarly-titled amounts that we do not consider indicative of our core non-GAAP measures presented herein. As a result, the Pro measures used by other operating performance, including share-based Forma Adjusted EBITDA we present is defined consistently with companies. compensation, gains or losses on disposition of assets, the EBITDA measure used for covenant compliance under our impairment expense and changes in fair value of financial credit agreements. We are also including this disclosure to instruments. enable public investors to understand and assess our + Management believes these compliance with those covenants. We may, from time to time, non-GAAP measures provide useful + We believe Adjusted EBITDA is useful in evaluating our ability disclose covenant calculations as required by our agreements; to generate earnings from our operating base and to information to investors by offering such disclosures are provided for compliance assessment and compare our performance across periods, particularly where greater transparency into transparency. In addition, including pre-acquisition results non-cash expenses and other items may vary in timing and improves the alignment between income statement activity operating performance and amount. This measure has historically been utilized both and the balance sheet, as the balance sheet fully reflects the comparability across. internally and externally to assess liquidity, reinvestment impact of acquisition accounting while the income statement capacity, and shareholder returns. would otherwise present only a partial period of + Reconciliations of these non-GAAP post-acquisition results. Therefore, key financial metrics such financial measures to the most as leverage ratios would be distorted without this adjustment. Furthermore, we believe Pro Forma Adjusted EBITDA enhances Free Cash Flow directly comparable GAAP consistency and comparability across periods and provides a measures are provided within this + Represents net cash used in operating activities less capital more representative view of the consolidated entity’s future Appendix. earnings potential. expenditures and additions to internally developed software. + This presentation allows users to assess our ability to reinvest in + Certain forward-looking non-GAAP the business, pursue strategic transactions and return capital measures are presented without to investors. reconciliation to GAAP due to the inherent difficulty of forecasting certain items without unreasonable efforts.
30 Disclaimer About this Presentation This investor presentation (this “Presentation”) is provided by Teamshares Inc. (the “Company”) for informational purposes only and for no other purpose. The information contained herein does not purport to be all-inclusive and none of the Company or any of its representatives or affiliates makes any representation or warranty, express or implied, as to the accuracy, completeness or reliability of the information contained in this Presentation. You should not construe the contents of this Presentation as legal, tax, accounting or investment advice or a recommendation. You should consult your own counsel and tax and financial advisors as to legal and related matters concerning the matters described herein. Forward-Looking Statements This Presentation contains certain forward-looking statements within the meaning of Section 27A of the U.S. Securities Act of 1933, as amended (the “Securities Act”), and Section 21E of the U.S. Securities Exchange Act of 1934, as amended, that are based on beliefs and assumptions and on information currently available to the Company. Forward-looking statements generally relate to future events or the Company’s future financial or operating performance. For example, statements regarding anticipated growth in the industry in which the Company operates and anticipated growth in demand for the Company’s products and services are forward-looking statements. In some cases, you can identify forward-looking statements by terminology such as “pro forma”, “may”, “should”, “could”, “might”, “plan”, “possible”, “project”, “strive”, “budget”, “forecast”, “expect”, “intend”, “will”, “estimate”, “anticipate”, “believe”, “predict”, “potential” or “continue”, or the negatives of these terms or variations of them or similar terminology. Such forward-looking statements are subject to risks, uncertainties, and other factors which could cause actual results to differ materially from those expressed or implied by such forward-looking statements. These forward-looking statements are based upon estimates and assumptions that, while considered reasonable by the Company and its management, as the case may be, are inherently uncertain. Factors that may cause actual results to differ materially from current expectations include, but are not limited to: failure to realize the anticipated benefits of business combinations and other investment opportunities and ventures undertaken by the Company; the failure of the Company to maintain the listing of its securities on any stock exchange; the ability of the Company to grow and manage growth, maintain relationships with customers and retain its management and key employees; changes in applicable laws or regulations; the possibility that the Company may be adversely affected by other economic, business or competitive factors; the Company’s estimates of expenses and profitability; the evolution of the markets in which the Company competes; the ability of the Company to implement its strategic initiatives and continue to innovate its existing products and services. Nothing in this Presentation should be regarded as a representation by any person that the forward-looking statements set forth herein will be achieved or that any of the contemplated results of such forward-looking statements will be achieved. You should not place undue reliance on forward-looking statements, which speak only as of the date they are made. The Company undertakes no duty to update these forward-looking statements. No Offer or Solicitation This Presentation does not constitute or form part of, and should not be construed as, an offer to sell, a solicitation of an offer to buy, or a recommendation to purchase any securities of the Company, nor shall there be any sale of securities in any state or other jurisdiction to any person of entity to which it is unlawful to make such offer, solicitation or sale in such state or jurisdiction. No such offering of securities shall be made except by means of a prospectus meeting the requirements of Section 10 of the Securities Act, or an exemption therefrom.
31 Disclaimer Financial Information; Non-GAAP Financial Measures Some of the financial information and data contained in this Presentation, such as Adjusted EBITDA, Pro Forma Adj. EBITDA, Free Cash Flow, have not been prepared in accordance with United States generally accepted accounting principles (“GAAP”). The Company believes that the use of these non-GAAP financial measures provides an additional tool for investors to use in comparing the Company’s financial condition and results of operations with other similar companies, many of which present similar non-GAAP financial measures to investors, and to assess certain financial and business trends relating to the Company’s financial condition and results of operations. Among other things, the Company’s management uses these non-GAAP measures for trend analyses and for budgeting and planning purposes. Management does not consider these non-GAAP measures in isolation or as an alternative to financial measures determined in accordance with GAAP. The principal limitation of these non-GAAP financial measures is that they exclude significant expenses and income that are required by GAAP to be recorded in the Company’s financial statements. In addition, they are subject to inherent limitations as they reflect the exercise of judgments by management about which expenses and income are excluded and included in determining these non-GAAP financial measures. In order to compensate for these limitations, management presents non-GAAP financial measures in connection with GAAP results. Because non-GAAP financial information is not standardized, it may not be possible to compare these financial measures with other companies’ non-GAAP financial measures. Use of Projections This Presentation contains projected financial information with respect to the Company. The projected financial information constitutes forward-looking information, is for illustrative purposes only and should not be relied upon as necessarily being indicative of future results. The assumptions and estimates underlying such financial forecast information are inherently uncertain and are subject to a wide variety of significant business, economic, competitive and other risks and uncertainties. See “Forward-Looking Statements” above. Actual results may differ materially from the results contemplated by the financial forecast information contained in this Presentation, and the inclusion of such information in this Presentation should not be regarded as a representation by any person that the results reflected in such forecasts will be achieved. Industry and Market Data Market data and industry information used throughout this Presentation are based on management’s knowledge of the industry and the good faith estimates of management. Management also relied, to the extent available, upon management’s review of independent industry surveys and publications and other publicly available information prepared by a number of third-party sources. All of the market data and industry information used in this Presentation involves a number of assumptions and limitations, and you are cautioned not to give undue weight to such estimates. Although the Company believes that these sources are reliable, it cannot guarantee the accuracy or completeness of this information, and it has not independently verified this information. While the Company believes the estimated market position, market opportunity and market size information included in this Presentation are generally reliable, such information, which is derived in part from management’s estimates and beliefs, is inherently uncertain and imprecise. No representations or warranties are made by the Company or any of its affiliates as to the accuracy of any such statements or projections. Projections, assumptions and estimates of the Company’s future performance and the future performance of the industry in which the Company operates are necessarily subject to a high degree of uncertainty and risk due to a variety of factors, including those described in the Company’s registration statements, and prospectuses and prospectus supplements filed with the SEC. These and other factors could cause results to differ materially from those expressed in the Company’s estimates and beliefs and in the estimates prepared by independent parties. Trademarks and Intellectual Property This Presentation may contain trademarks, service marks, trade names and copyrights of other companies, which are the property of their respective owners. Their use is not alone intended to, and does not, imply a relationship with any party or an endorsement or sponsorship by or of any party. Solely for convenience, some of the trademarks, service marks, trade names and copyrights referred to in this Presentation may be listed without the TM, SM, © or ® symbols, but such references are not intended to indicate, in any way, that any party or the applicable rights owner will not assert, to the fullest extent under applicable law, its rights or the rights of the applicable owner or licensor to these trademarks, service marks, trade names and copyrights.